Don’t fly blind. See exactly what your customers are asking and how they feel about the answers.
Turn conversations into actionable insights.
Our interaction heatmap shows when users engage most with your website AI—hour by hour, day by day. Identify peak traffic windows, uncover behavioural trends, and optimise your AI strategy based on real usage data.
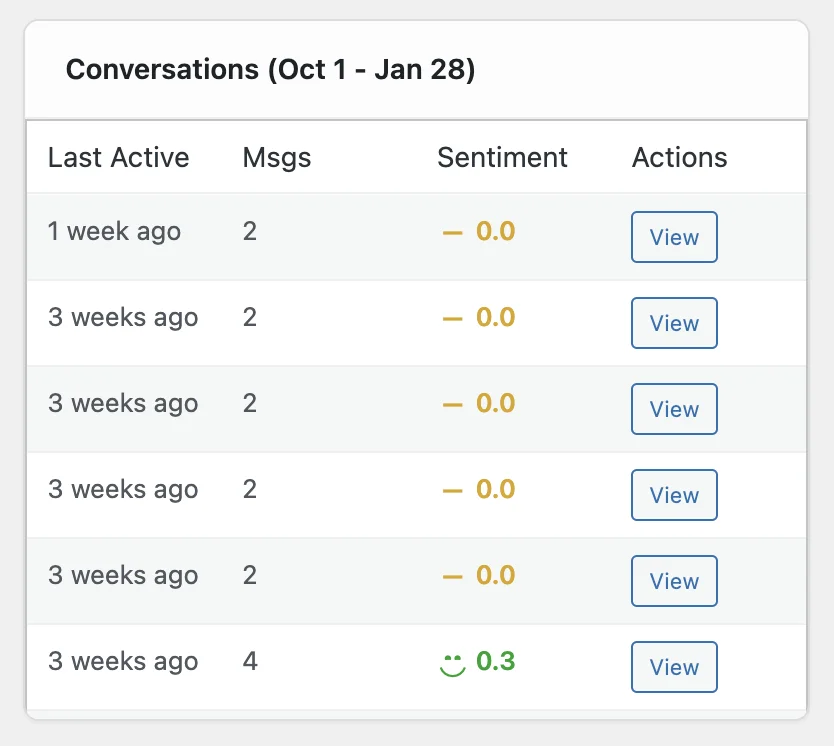
Sentiment Pulse
Measure how users feel while interacting with your AI. Real-time sentiment analysis across every message highlights rising frustration or growing satisfaction, giving you early warning signals long before users leave.
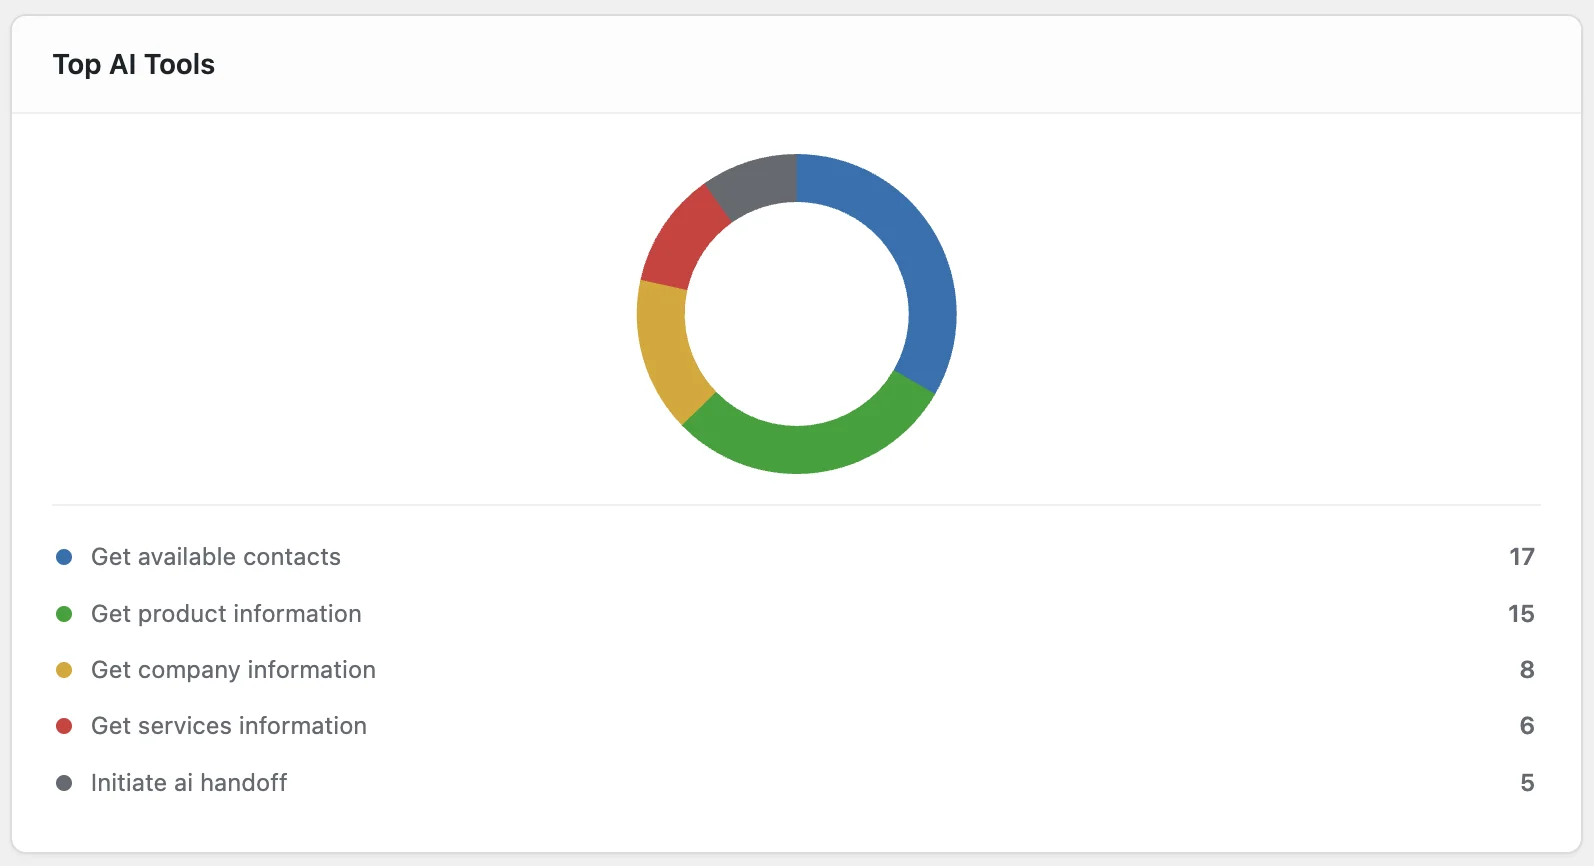
Tool Usage Insights
Every tool trigger tells a story. See which actions users rely on most and instantly spot content gaps, poor information architecture, or UX breakdowns that push users to ask the AI instead of finding answers on your site.
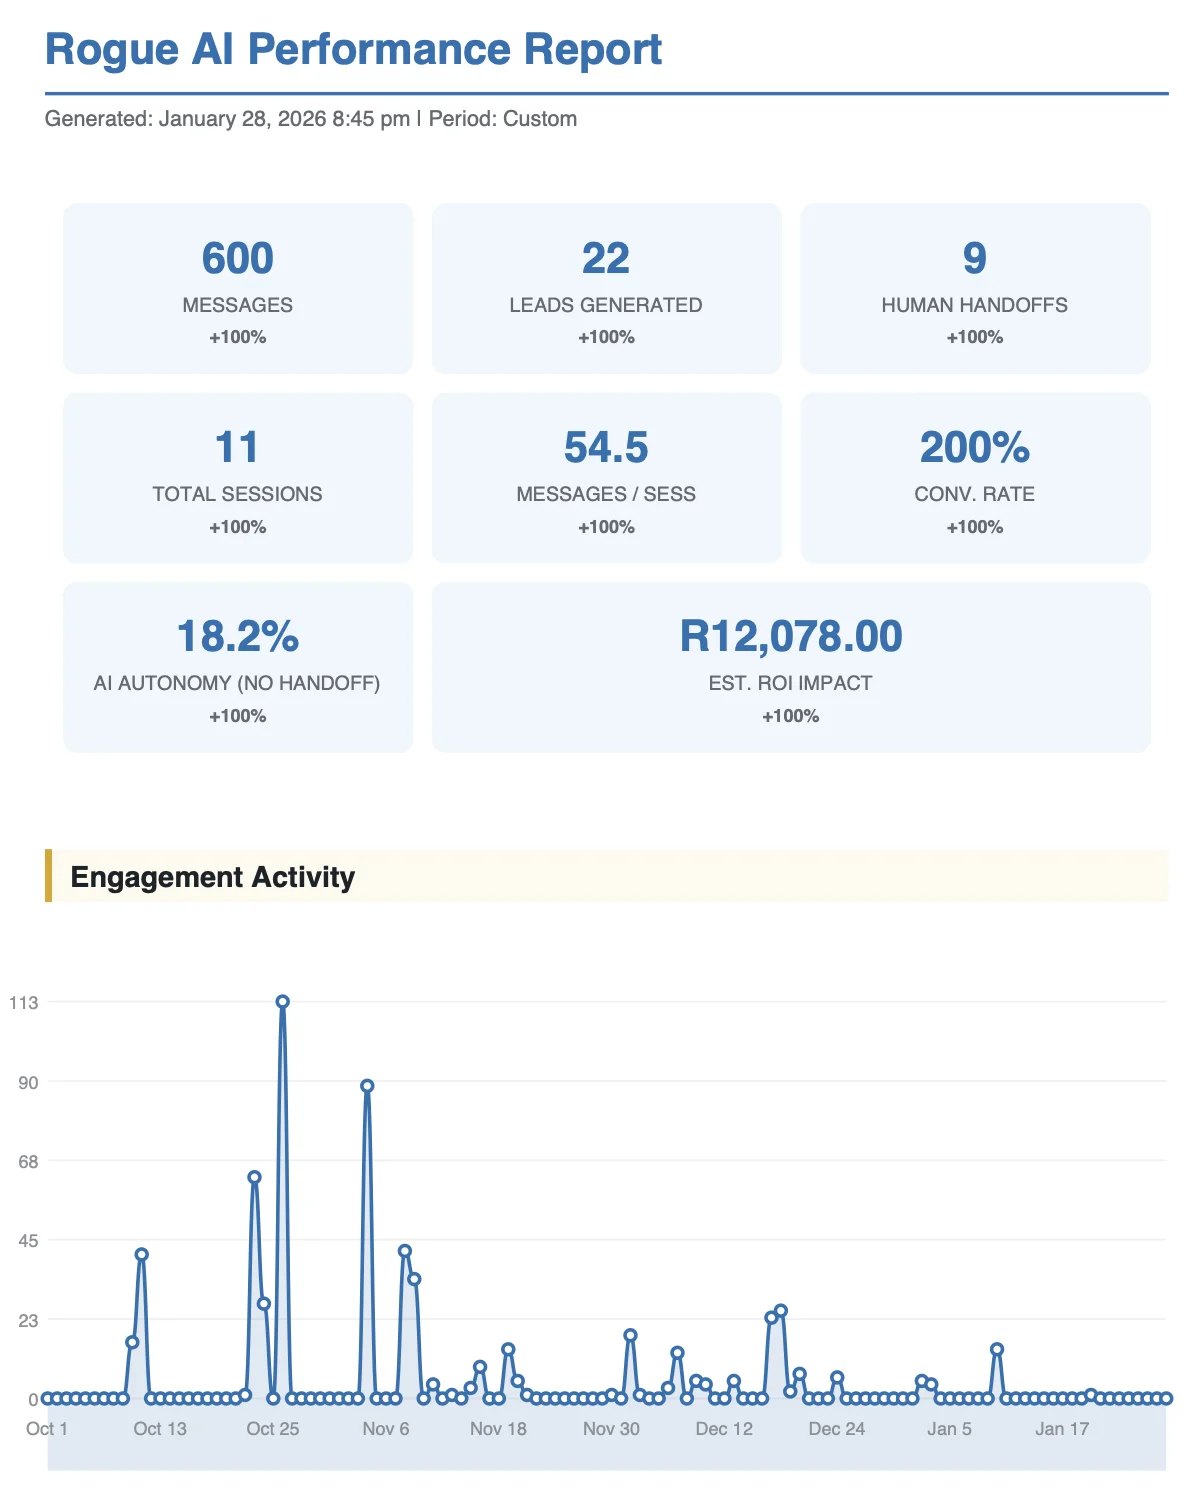
PDF Reports
Generate detailed PDF reports with built-in charts and analytics. Download manually or automate email delivery on your schedule—daily, weekly, monthly, or custom date ranges, including rolling periods like the last 30 or 45 days.
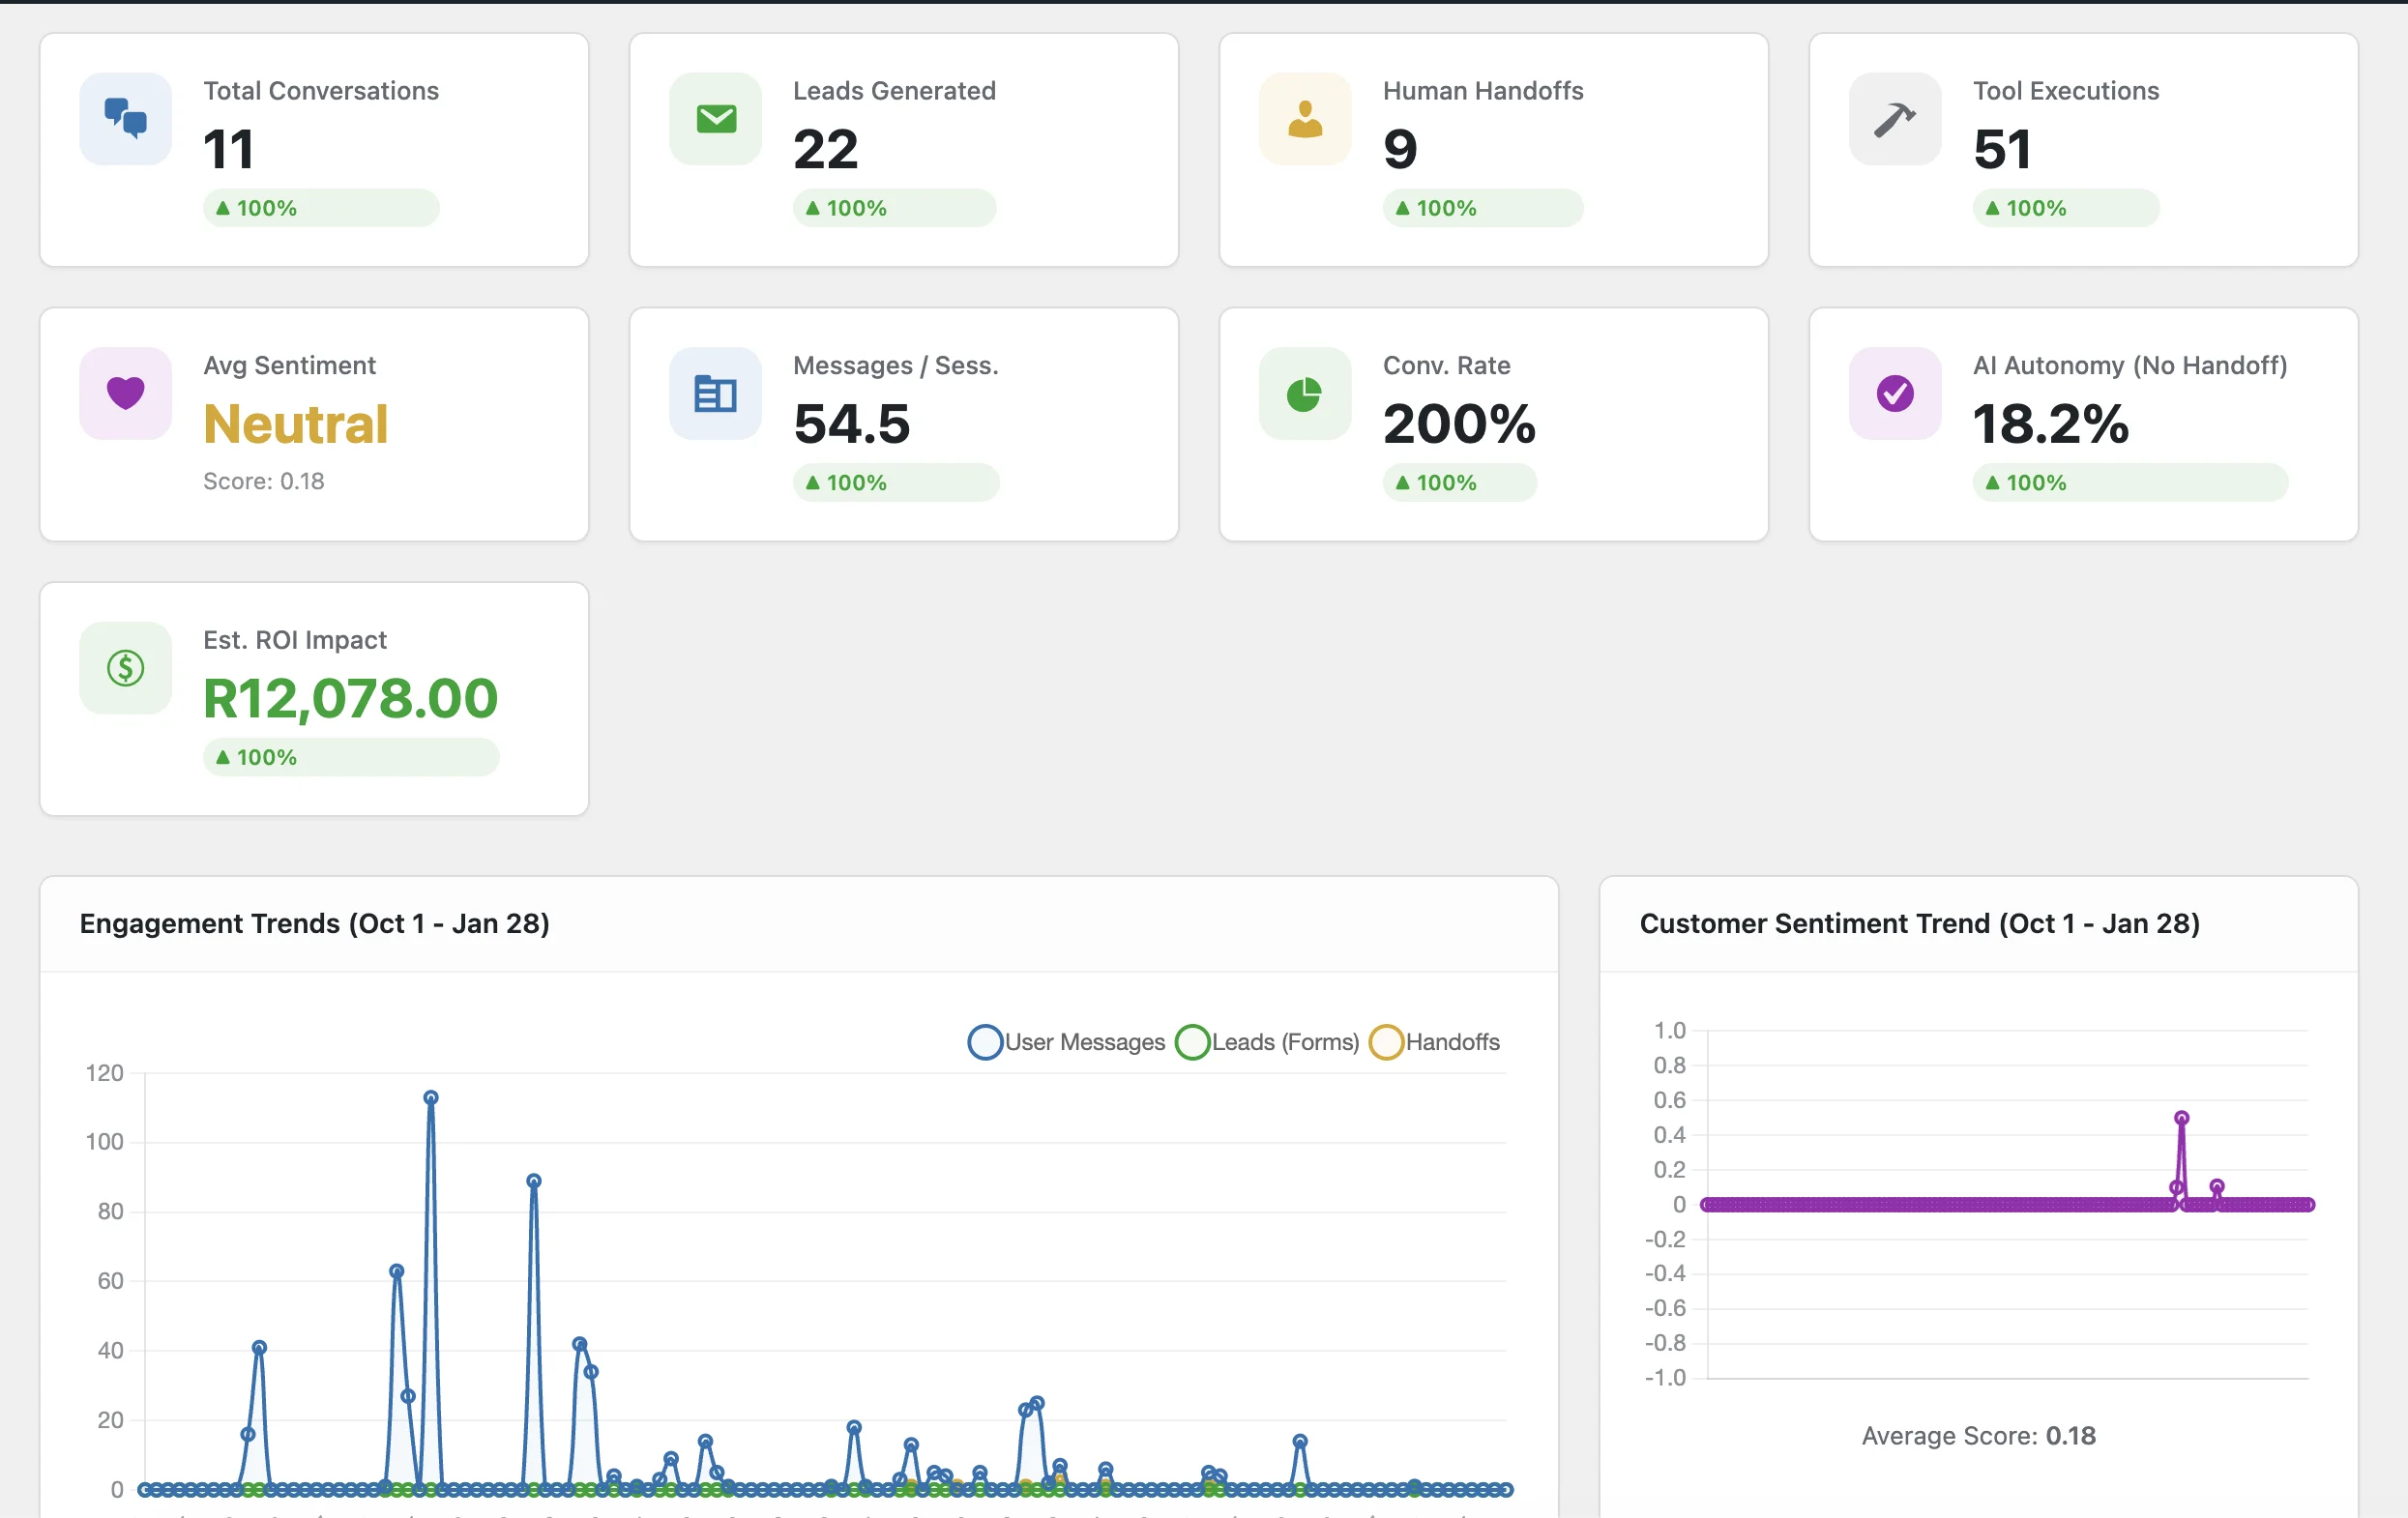
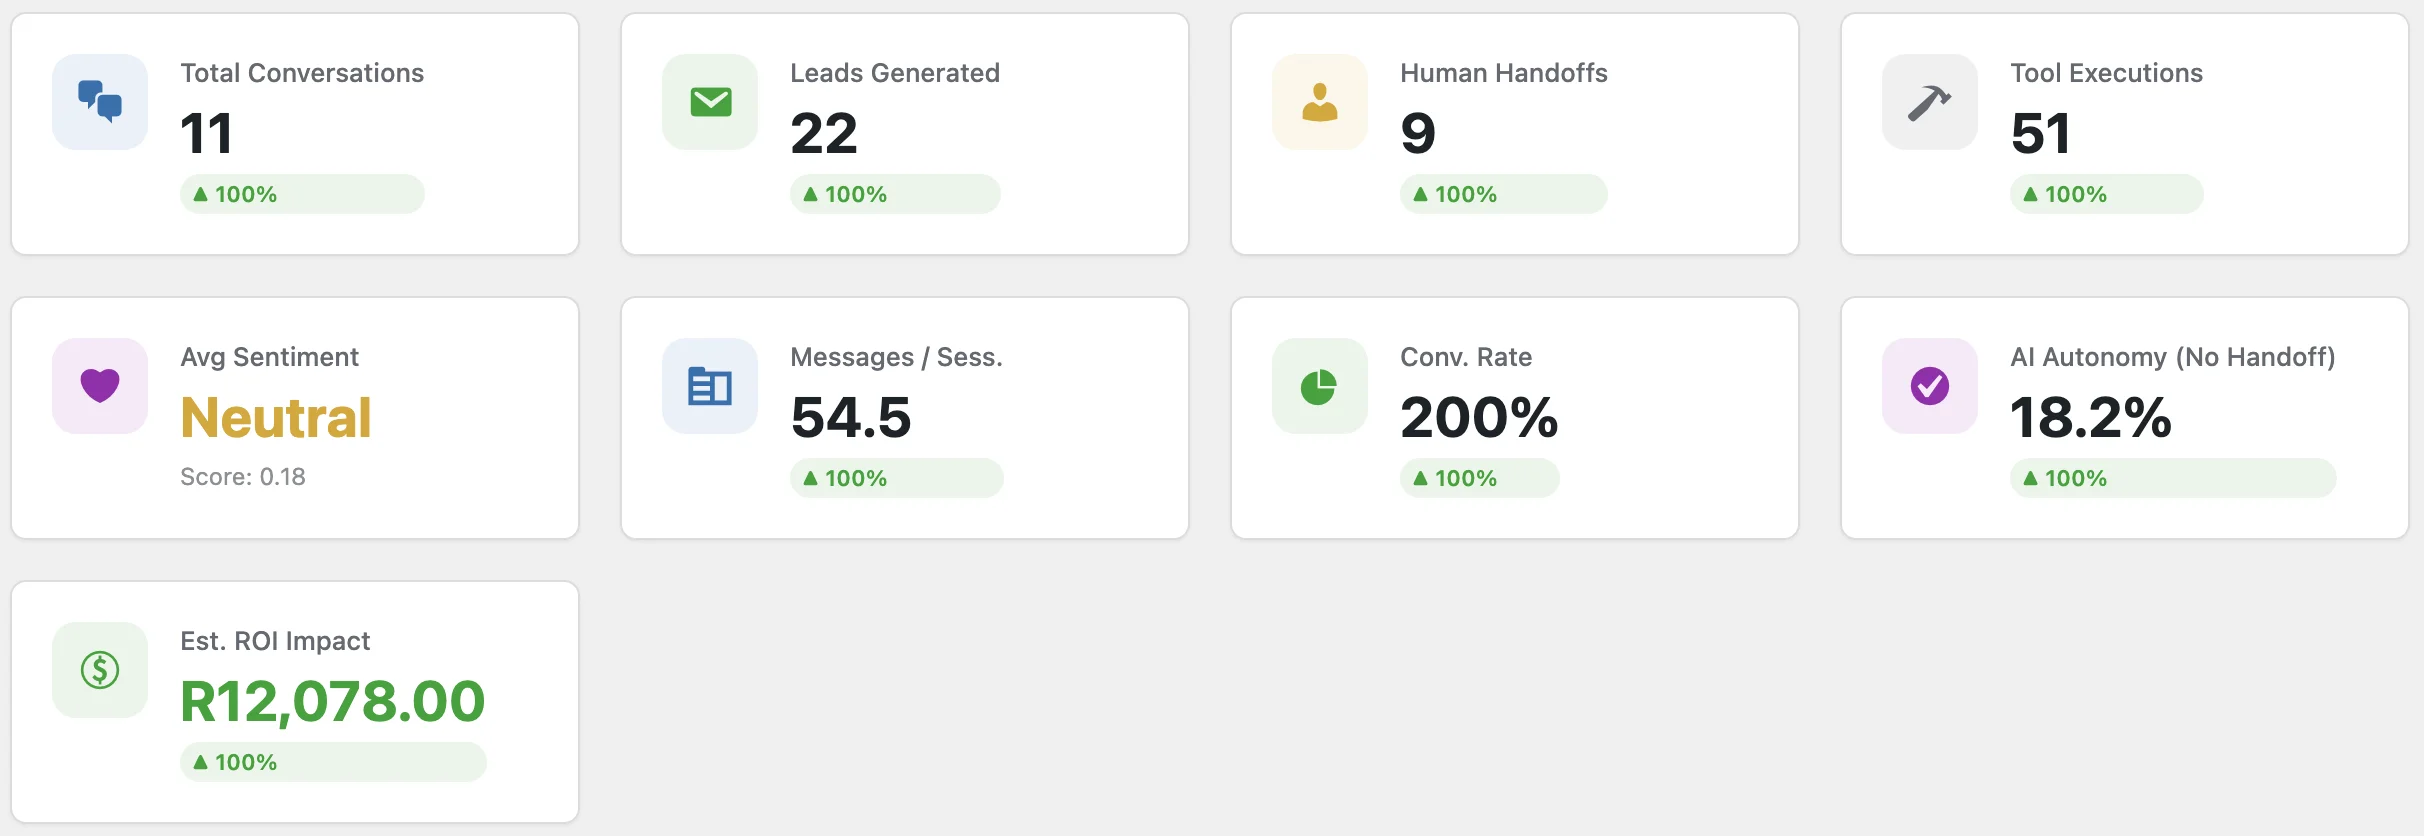
Key Performance Indicators
Get executive-level KPIs that adapt to your selected date range. ROI values support any currency and include potential revenue estimates, with automatic percentage comparisons against the previous period for fast, decision-ready insights.